Hydrogen wavefunctions
Now that we have the closed-form analytical expressions for the Hydrogen wavefunctions, namely:
$${\displaystyle \psi _{n\ell m}(r,\theta ,\varphi )={\sqrt {{\left({\frac {2}{na_\mathrm{B}}}\right)}^{3}{\frac {(n-\ell -1)!}{2n(n+\ell )!}}}}e^{-\rho /2}\rho ^{\ell }L_{n-\ell -1}^{2\ell +1}(\rho )Y_{\ell }^{m}(\theta ,\varphi )}$$
(where $\rho=2r/(na_\mathrm{B})$, $L$ are Laguerre polynomials $Y$ spherical harmonics) we can turn to the problem of their visualisation. At a technical level, this seems a fairly simple problem, since we merely have a 3D, in principle complex-valued but in many instances actually real-valued, function, which we can represent using a variety of techniques from computer graphics. We shall see that, however, one thing is to make a pretty picture, the other is to have an informative, clear, accurate and quantitatively correct picture. The latter case proves to be much more challenging and requires a combination of various representations.
At a deeper level, this also brings us into the problem of what it is we are actually looking at. At the level of the formalism, there is no ambiguity: we are looking at the density of probability amplitude of the electron distribution in space. Probability amplitude means that its modulus square gives the probability. Even with this correct and full understanding, this tells us little about what the electron itself actually is. It tells us, to be sure, where it can be found upon measurement, not quite what it actually is. Is it a diffuse wave like the wavefunction? Is it on the opposite a tiny particle that obeys to (or agrees with) the mathematics of the wavefunction? It is tempting to associate the mathematical apparatus to the physical object it describes. We shall see this quickly reaches its limits when turning to multiple particles. To this day, nobody knows what exactly is an electron and how it does bind to its nucleus. Still, for convenience, one typically regards the wavefunction as a sort of electronic cloud. In this process, we call them "orbitals" instead. So we come back to the mere "technical" problem of visualizing the well-defined wavefunction as a mathematical object. Given the structure of the solution $\psi_{nlm}=R_nY_l^m$, it is, in essence, a combination of a radial part (a combination of $r^l\exp(-r)$ [the peeled-off] with Laguerre polynomials) with a more structure angular part. The former part constitutes the full problem for $l=0$ as there is rotational symmetry.
The latter part consists exactly of the well-known spherical harmonics, which play a role when $l\neq 0$, at which step the problem becomes non-radially symmetric and raises one step up in complexity. The visualization of spherical harmonics alone can be done in 3D using the radial distance to give the magnitude of the function for each $(\theta, \phi)$ angles, which is possible to do since spherical harmonics are defined on the sphere and do not depend on $r$. The colour gives the sign, and we find these characteristic structures:
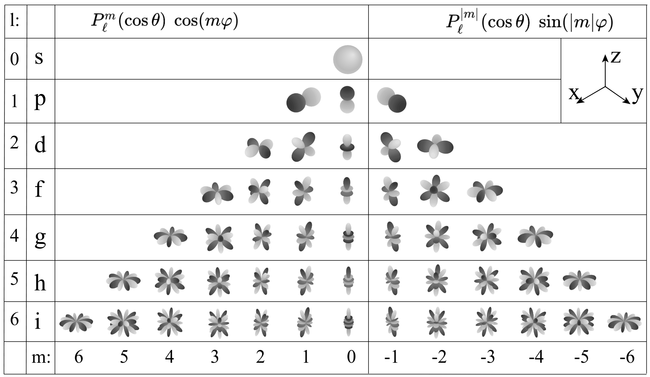
Of course when plotting in 3D it is possible to make it more or less pretty (see here for a 3D rendered version).
The radial parts are basically oscillating decaying exponentials, as we will see in the following. To embrace the full structure together, let us first remind the mathematical classification of the states. For hydrogen, the stationary orbitals are specified by three quantum numbers:
$$n,\quad l\quad\text{and}\quad m$$
- The number $n$ or principal quantum number can take any positive integer value, $n=1, 2, \cdots$. It describes the energy and also the average distance of the electron from the nucleus, thus, qualitatively, its size. Orbitals with the same $n$ are, for this reason, collectively described as belonging to the same "shell". It already appears in the Bohr model.
- The number $l$, or azimuthal quantum number, describes the rotation, or angular momentum, of the electron. It describes, qualitatively, the shape of the orbital. It is an integer, possibly and always at least zero, otherwise strictly bounded by the principal quantum number: $0\le l\le n-1$. The orbitals with the same $n$ and $l$ are called "subshells". They are denoted $s$ (sharp) for $l=0$, $p$ (principal) for $l=1$, $d$ (diffuse) for $l=2$ and $f$ (fundamental) for $l=3$ due to historical reasons (?!) and proceed beyond that alphabetically at the exception of j which is skipped: $g, h, i, k, l, \cdots$ This gives rise to naming such as 1s ($n=1, l=0$, i.e., the ground state) or $2p$ ($n=2$, $l=1$).
- The number $m$, or magnetic quantum number, can take negative values, and is bounded in absolute value by $l$: $-l\le m\le l$. It describes, qualitatively, the orientation of the orbital.
The $s$ subshells are shaped like spheres, with the ground state being simply a fading ball. Higher $n$ with $l=0$ have radial (spherical) symmetry but with oscillations due to destructive interferences. The $s$ orbitals are the only ones with an antinode at the centre (where the nucleus is) while other orbitals present a node there. This does not invalidate the model, though, as the probability for the electron to be actually found there remains negligible and otherwise accounts for small (relativistic quantum-field) effects.
There are three $p$-orbitals (starting at $n=2$) corresponding to $m=\pm1$ and 0. One ($m=0$) has the form of two ellipsoids pointing in opposite directions and pinned by a node at the nucleus, while the two others are complex-valued and donut-shaped instead, but with the same alignment to the chosen axis (typically, $z$). This is the typical Physics' representation of the orbitals. In chemistry, linear superposition are taken so that the $m=\pm1$ wavefunctions are real-valued like the $m=0$ one, also acquiring the same bi-ellipsoidal shape but now pointing perpendicularly oriented the ones from the others, so as to be aligned with the Cartesian axis vectors $\hat\imath$, $\hat\jmath$ and $\hat k$. Such choices can also be made for the higher orbitals, in which case they share a much more uniform aspect but pointing in different directions of space. This corresponds to working with cubic harmonic instead of spherical ones:
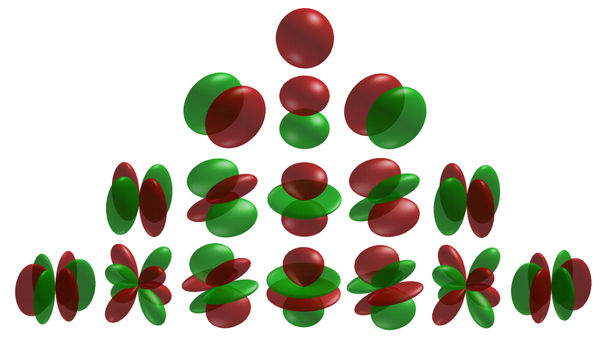
The progression from there onward is fairly generic: there are five $d$-orbitals (starting at $n=3$) corresponding to $m=\pm2, \pm1$ and 0, with also fairly symmetric and consistent shapes (rotating) in terms of cubic harmonic (as shown just above) or instead as intertwined donuts.
We can now turn to the actual representation of these orbitals. The typical representation is in terms of solid-looking bodies, which are defined by a probability threshold (chosen for each case to produce nice-looking results) that encloses a volume of space where the electron is to be found with at least this probability. The color depicts the sign, or in more sophisticated cases and when the need arises, the phase of the complex-valued wavefunction at the corresponding point. The s orbitals are often cut open to reveal the inner structure of this otherwise rotationally symmetric case. Such a representation [1]—from Geek3—is given below, with the wavefunctions taen in the basis or orbitals that are symmetric around the $z$ axis (Physics representation of spherical harmonics instead of cubic harmonics):
Variations can be found. The rigid-body picture is great to convey the geometrical shape of the orbitals, but it is deceiving with regard to the actual distribution, since the wavefunction is not, in particular, such abruptly defined (this comes from a choice of a threshold). A good link between this rigid-body representation (and its threshold) to the wavefunction itself is provided by the Orbitron (see [2] for the animation below) which is a platform that offers various and complementary visualization of hydrogen orbitals.
As one can see, the choice of the threshold is crucial to the depicted shape. Too small and some geometrical features (lobes or rings) are not included, too large and the result englobes the full space. In this regard, a density plot is more informative. The orbitron also proposes a "dots" representation that samples randomly from the probability distribution (projected in 2D) to produce such a counterpart, still for the the $2s$ state:
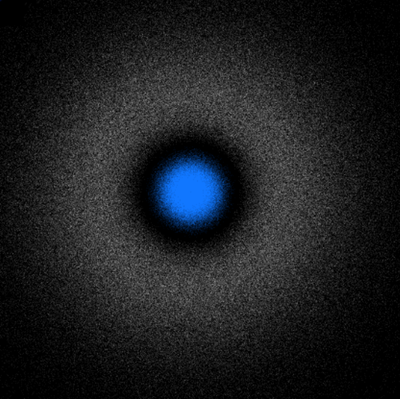
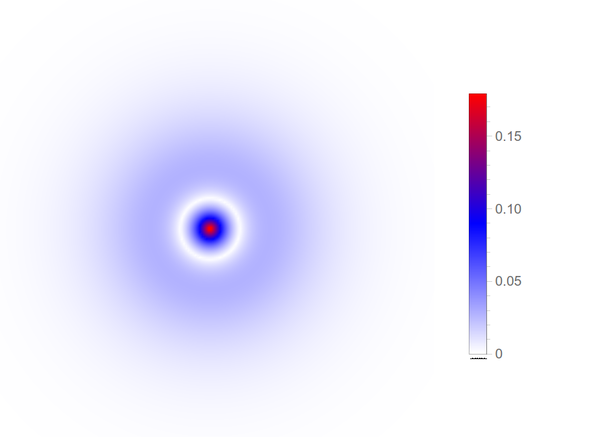
Here is the density plot proper, which shows $|\psi_{200}|(x,y)$ (note, the absolute value, not its square, which lowers the contrast of the plot):
This is a fairly equivalent representation than the previous cloud of "dots" just above, but see how both still differ substantially. One misleading idea which they both convey is that the electron is to be found mainly in the dense, inner part (in blue for the orbitron, in red for our density plot). This doesn't take into account the phase-space available:
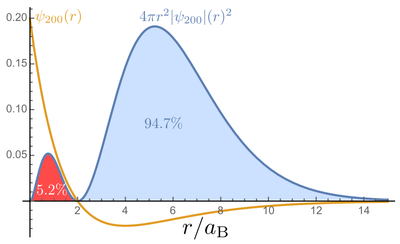
When comparing the above representations, it would seem that one could simply merge the benefits of all of them with a 3D density-plot, involving transparency and cut-out regions to see inside. Such an approach has been investigated by Jacopo Bertolotti who proposed the strikingly concise Mathematica code below:
\[Alpha]0 = 1;
\[Psi][n_, l_, m_, r_, \[Theta]_, \[Phi]_] := Sqrt[(2/(n \[Alpha]0))^3 (n - l - 1)!/(2 n ((n + l)!))] E^(-r/(n \[Alpha]0)) ((2 r)/(n \[Alpha]0))^l LaguerreL[n - l - 1, 2 l + 1, (2 r)/(n \[Alpha]0)] SphericalHarmonicY[l, m, \[Theta], \[Phi]];
p1 = Flatten@Table[
   f = TransformedField["Spherical" -> "Cartesian", \[Psi][n, l, m, r, \[Theta], \[Phi]], {r, \[Theta], \[Phi]} -> {x, y, z}];
   DensityPlot3D[Abs[f]^2
    , {x, -30, 30}, {y, -30, 30}, {z, -30, 30}, ColorFunction -> Hue, ColorFunctionScaling -> True, Boxed -> False, Axes -> False, PlotLabel -> Style[StringForm["Hydrogen atom orbitals\n |\[Psi]\!\(\*SuperscriptBox[\(|\), \\(2\)]\) : n=`` l=`` m=``", n, l, m], Medium, FontFamily -> "DejaVu Serif"], LabelStyle -> {Black, Bold}, RegionFunction -> Function[{x, y, z}, x < 0 || y > 0], PlotLegends -> Automatic], {n, 1, 4}, {l, 0, n - 1}, {m, -l, l}]
This is for instance how the 1s (the simplest possible orbital) is rendered using such a code:
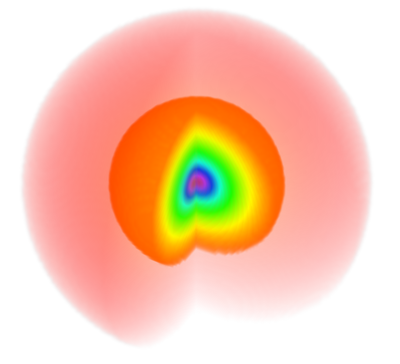
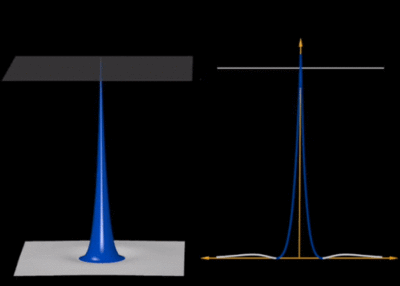
One can see that despite clear assets of its own, it also comes with severe limitations especially in terms of artefacts such as the appearance of fake shells (the cloud should be uniformly fading towards zero). The color code is such that yellowish-orangeish-redish colors fade into zero and blueish-purplish or (confusingly, extremely red) colors peak into the highest values (see it here exactly for $\psi_{100}$) so it is also slightly confusing that the cloud dies into white (as expected) instead of reddish (which is what the glowing effect is certainly attempting to produce). Here is, with the same colour code as the density plot, the same representation for the 2s state (with the 1D wavefunction overlayed):
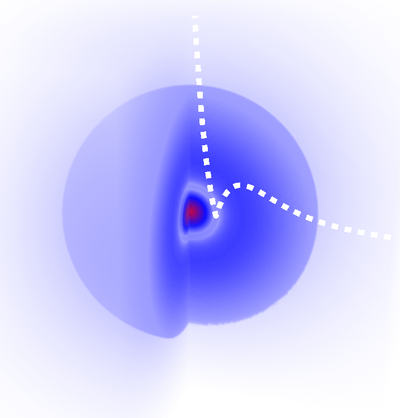
This still-other representation [3], also by Geek3, is another attempt at combining techniques. It uses transparency and 3D rendering of the with the colour depicting the sign of $\psi$. The cloud gives a more realistic representation of the diffused orbital than the solid-body approximations:
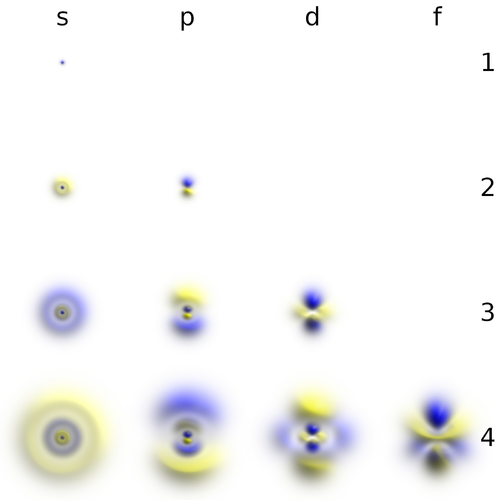
Let us now compare these visualisations for a "complicated" orbital, for instance $4d$ with $m=0$ or $4d_0$. This is is the rigid-body representation (also cf. the first table above):
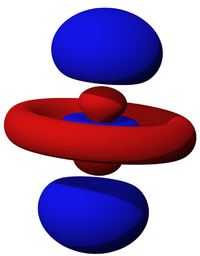
Notice how the artist skillfully chose the threshold so that all the lobes are actually visible. This is usefully compared to the orbitron again:
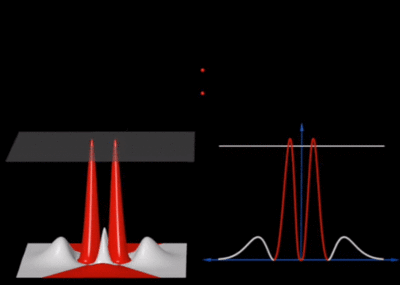
Of course, each artist uses their own conventions of colours, among other things! This is the $4d_0$ wavefunction as a transparent and cut-open 3D density plot with a 2D-density-plot slicing through it:
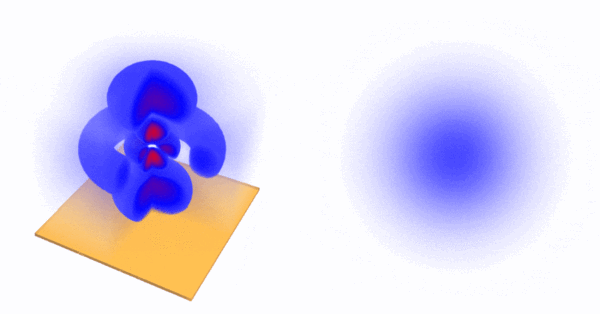
Other slicing are possible. The Mathematica notebook used to produce these animations is provided below. The exhibitions above should convince you of the benefits and shortcomings of each method. Maybe you have your own intuition on how to make these objects more accurately and comfortably visualized. It is, in any case, a good exercise to try one's hands at representing graphically these extremely fundamental and elusive physical objects. If not, it is always enlightening to look at the efforts of others. We conclude with a list of resources, interactives or not, that display the electron orbitals. From an otherwise purely physical point of view, even though the above solutions are exact for hydrogen alone, the orbitals of multi-electron atoms are qualitatively similar to these and constitute the foundation for chemistry, so they remain extremely important to understand well and thoroughly.
Links
- Mathematical notebook to produce the slicing animations above.
- The grand orbital table, the most complete orbital table available (still images).
- The orbitron with nice animations and complementary representations.
- Java Applet with a lot of unique features, such as dynamic superpositions of different orbitals. It also performs very well as a 3D interactive density-plot viewer.
- Density cloud by Daniel Svane. Fast rendering with code available.
- Paper in J. Comput. Chem. Jpn., Vol. 5, No. 3, pp. 159–164 (2006).
