

The effect of the pump and the SC/WC phase space
The different regions that can appear when the incoherent continuous
pump is turned on, are plotted in Fig. 4.4
as a function of the pumping rates. All the possibilities are defined
in terms of
![]() and
and
![]() being zero or not. The
conditions arising are linked to
being zero or not. The
conditions arising are linked to ![]() (that can only be real or pure
imaginary) although not so straightforwardly as in the absence of
pump.
(that can only be real or pure
imaginary) although not so straightforwardly as in the absence of
pump.
![\includegraphics[width=0.7\linewidth]{chap4/Fig3.ps}](img1150.png) |
The most extended region is the standard (First order) Strong Coupling (FSC, in light blue), which includes the SC regime in the absence of pump. The situation with the levels is that of Fig. 4.1(b). It is characterized by
from what follows that
The two pairs of peaks 1, 4 and 2, 3 are placed one on top of each other although they are differently broadened [see the spectra of Fig. 4.3 and of Fig. 4.5(a) and (d)]. In this region,
In Fig. 4.6(a) and (b) we track the
broadenings and positions of the four peaks (1 and 4 in blue and 2 and
3 in red) as a function of pump, through the SC region of
Fig 4.4, on the line
![]() . Following them from zero pump, where the manifold
picture is exact, the four peaks can be easily associated with the
lower and upper transitions of
Fig. 4.1(b), and that is why we use the
same color code. The dressed states
. Following them from zero pump, where the manifold
picture is exact, the four peaks can be easily associated with the
lower and upper transitions of
Fig. 4.1(b), and that is why we use the
same color code. The dressed states ![]() and
and ![]() exist but
with energies
exist but
with energies
![]() , both affected equally by
decoherence.
, both affected equally by
decoherence.
![\includegraphics[width=0.45\linewidth]{chap4/Fig2a.eps}](img1159.png)
![\includegraphics[width=0.45\linewidth]{chap4/Fig2b.eps}](img1160.png)
![\includegraphics[width=0.45\linewidth]{chap4/Fig2c.eps}](img1161.png)
![\includegraphics[width=0.45\linewidth]{chap4/Fig2d.eps}](img1162.png)
![\includegraphics[width=0.45\linewidth]{chap4/Fig2e.eps}](img1163.png)
![\includegraphics[width=0.45\linewidth]{chap4/Fig2f.eps}](img1164.png) |
By construction, the resulting spectra in this regime can only be a doublet [Fig. 4.5(a)] or a single peak [Fig. 4.5(d)], depending on the magnitude of the broadening of the peaks (that always increases with pump and decay) against the splitting of the lines (that always decreases). As in the LM, observing a doublet in the spectra is not granted in SC, but here the tendency is always the same: the lower the pump and the decay, the better the resolution of the splitting.
The second situation, the Rabi frequency being imaginary,
opens three possibilities, that constitute the three remaining regions in Fig. 4.4. In what follows we assume condition Eq. (4.33) and add new conditions to define the three such regions.
The Weak Coupling regime (WC, in purple) is characterized by
and therefore
Up to here, we have studied the SC and WC as they appeared defined in
the LM. We find a new region of SC, when both parameters ![]() are
real and
are
real and
We call it Second order Strong Coupling regime (SSC, colored in dark blue in the phase space). Here, the broadenings of the four peaks are equal,
We can see how peak broadenings and positions change when going from
FSC to SSC in Fig. 4.6(c)-(d). In this
case, we track the peaks by varying ![]() for fixed
for fixed ![]() ,
moving from the points (a) to (c) in the phase space. The first
vertical line marks the border between the two kinds of SC, with the
opening of a ``bubble'' for the positions
,
moving from the points (a) to (c) in the phase space. The first
vertical line marks the border between the two kinds of SC, with the
opening of a ``bubble'' for the positions ![]() and
and ![]() (that were equal in the FSC region), and the convergence of all the
broadenings. The spectrum we choose from this region,
Fig. 4.5(b), features a single peak
despite the subtle underlying structure. In principle, quadruplets and
triplets can form out of the four peaks. However, the broadenings and
contributions of the dispersive parts (
(that were equal in the FSC region), and the convergence of all the
broadenings. The spectrum we choose from this region,
Fig. 4.5(b), features a single peak
despite the subtle underlying structure. In principle, quadruplets and
triplets can form out of the four peaks. However, the broadenings and
contributions of the dispersive parts (![]() ) are too large to let the
fine splittings emerge clearly. The spectra in this region are
singlets and doublets but we will see in
Sec. 4.4 with other examples, that they can
be very distorted, undoubtly reflecting the multi peaked structure.
) are too large to let the
fine splittings emerge clearly. The spectra in this region are
singlets and doublets but we will see in
Sec. 4.4 with other examples, that they can
be very distorted, undoubtly reflecting the multi peaked structure.
The last new region in Fig. 4.4, appears
when ![]() is imaginary and
is imaginary and ![]() real, or equivalently,
real, or equivalently,
This is a Mixed Coupling regime (MC, colored in green in the phase space) where the two inner peaks, 1 and 4, have collapsed at the origin in WC, and so has the associated eigenstate
![\includegraphics[width=\linewidth]{chap4/Fig4.ps}](img1181.png) |
The manifold picture successfully associates the peaks that compose
the spectrum of emission to transitions between the levels. In order
to understand better some features of the spectra of the SS under
incoherent pump in the different regions that we have defined, we will
now push the manifold method--adequate for vanishing pump--a bit
further. Note that, in this system, the pumping mechanism is of the
same nature than the decay, due to the saturation of both QDs and the
symmetry in the schema of levels that they form. The master equation
is symmetrical under exchange of the pump and the decay
(
![]() ) when the two levels of both 2LS
are inverted (
) when the two levels of both 2LS
are inverted (
![]() and
and
![]() ).4.2 Consequently, the parameters
).4.2 Consequently, the parameters ![]() ,
, ![]() and
and ![]() ,
and also the populations of all the levels, are symmetric in the same
way, as it happens with just one 2LS (see
Sec. 2.5.1). In other systems we study in
this manuscript, like the LM, the JCM or simply the single HO, the
effect of the pump extends upwards to an infinite number of manifolds
while the decay cannot bring the system lower than the ground
state. There is no natural truncation for the pump (that ultimately
leads to a divergence), as there is for the decay. But with coupled
2LSs, state
,
and also the populations of all the levels, are symmetric in the same
way, as it happens with just one 2LS (see
Sec. 2.5.1). In other systems we study in
this manuscript, like the LM, the JCM or simply the single HO, the
effect of the pump extends upwards to an infinite number of manifolds
while the decay cannot bring the system lower than the ground
state. There is no natural truncation for the pump (that ultimately
leads to a divergence), as there is for the decay. But with coupled
2LSs, state ![]() is the top counterpart of
is the top counterpart of ![]() , undergoing
a saturation when pump or decay is large, respectively. This implies,
for instance, that the spectra in the limit of vanishing decay is
exactly the same as that of vanishing pump and that in such case we
can also apply the manifold method to obtain the right positions and
broadenings as a function of pump, in the same way that we did as a
function of decay only. We only have to take into account the
mentioned symmetry consistently. As long as the dynamics moves upwards
or downwards only, even when intermediate states are coupled, the
manifold method is suitable.
, undergoing
a saturation when pump or decay is large, respectively. This implies,
for instance, that the spectra in the limit of vanishing decay is
exactly the same as that of vanishing pump and that in such case we
can also apply the manifold method to obtain the right positions and
broadenings as a function of pump, in the same way that we did as a
function of decay only. We only have to take into account the
mentioned symmetry consistently. As long as the dynamics moves upwards
or downwards only, even when intermediate states are coupled, the
manifold method is suitable.
The manifold diagonalization breaks, however, in the presence of both nonnegligible pump and decay. If we combine their effects in the nonhermitian Hamiltonian as

we do not obtain the right results of four--in principle different--peaks but rather the standard pairing with
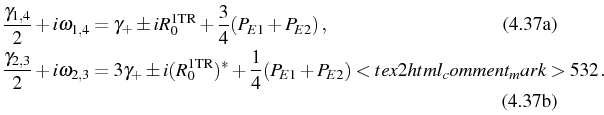
These expressions bring us back to the naive association of SC with
 , to describe the splitting
between the dressed states, cannot give the variety of situations than
the two parameters
, to describe the splitting
between the dressed states, cannot give the variety of situations than
the two parameters  (out of
resonance). The Rabi
(out of
resonance). The Rabi
Let us now look, for instance, at the positions and broadenings in
Figs. 4.6(a) and (b). In thin lines (with
the usual color code) we can see the approximate values from
Eq. (4.38). Not only do they deviate
quantitatively from the exact values, they are also qualitatively
wrong giving too late the transition into WC and a crossing of the
broadenings when they really repel and stay one above the other. The
joined presence of coupling, decay and pump has a more complicated
effect than simply bringing the excitations up and down the levels of
Fig. 4.1. The positions and broadenings
are also connected with the populations. For example, the anticrossing
of the broadenings takes place at the same point where the populations
of the intermediate states reach a maximum and state ![]() starts to be
the most populated. By reasoning with the manifold picture, the lower
transitions would have larger broadening than the upper, increasing
the pump after this point. However, the emptying of levels
starts to be
the most populated. By reasoning with the manifold picture, the lower
transitions would have larger broadening than the upper, increasing
the pump after this point. However, the emptying of levels ![]() and
and
![]() ,
, ![]() seems to decelerate this intuitive tendency. Even more
dramatic is the divergence between the approximate and the exact
positions and broadenings in Figs. 4.6(c)
and (d). Eqs. (4.38) cannot reproduce the
second anticrossing, as we said.
seems to decelerate this intuitive tendency. Even more
dramatic is the divergence between the approximate and the exact
positions and broadenings in Figs. 4.6(c)
and (d). Eqs. (4.38) cannot reproduce the
second anticrossing, as we said.
Elena del Valle ©2009-2010-2011-2012.