m (→Mathematica colours) |
m (→Mathematica colours) |
||
| (One intermediate revision by one user not shown) | |||
| Line 2: | Line 2: | ||
[[Mathematica]] has a rather extensive support for colors, but more often than not, it needs tinkering with. | [[Mathematica]] has a rather extensive support for colors, but more often than not, it needs tinkering with. | ||
| + | |||
| + | Colors can be retrieved from hexadecimal codes with a # in a string: | ||
| + | |||
| + | <wz tagtotip="rgbcode">[[File:Screenshot_20240921_115107.png|120px]]</wz> | ||
| + | <span id="rgbcode">RGBColor["#0e64fc"]</span> | ||
We like to use the ''SunsetColors'' color scheme: | We like to use the ''SunsetColors'' color scheme: | ||
| Line 33: | Line 38: | ||
PlotMarkers -> Graphics@{Point[{0, 0}] | PlotMarkers -> Graphics@{Point[{0, 0}] | ||
</pre> | </pre> | ||
| + | |||
| + | The default colors in modern versions of Mathematica is taken from: [https://mathematica.stackexchange.com/questions/54629/what-are-the-standard-colors-for-plots-in-mathematica-10] | ||
| + | |||
| + | <pre> | ||
| + | ColorData[97, "ColorList"] | ||
| + | </pre> | ||
| + | |||
| + | One can find the other useful themes [https://mathematica.stackexchange.com/questions/54486/how-to-access-new-colour-schemes-in-version-10] | ||
| + | |||
| + | <pre> | ||
| + | "Color"/. Charting`$PlotThemes | ||
| + | (* BackgroundColor, BlackBackground, BoldColor, ClassicColor, CoolColor, | ||
| + | DarkColor,GrayColor, NeonColor,PastelColor, RoyalColor, VibrantColor, WarmColor, | ||
| + | DefaultColor, EarthColor, GarnetColor, OpalColor, SapphireColor, SteelColor, | ||
| + | SunriseColor, TextbookColor, WaterColor} *) | ||
| + | |||
| + | Grid[{#,Row@(("DefaultPlotStyle"/.(Method/. | ||
| + | Charting`ResolvePlotTheme[#, ListPlot]))/. | ||
| + | Directive[x_,__]:>x)}&/@("Color"/. Charting`$PlotThemes),Dividers->All] | ||
| + | </pre> | ||
| + | |||
| + | <center><wz tip="Possible color themes from Mathematica. The default one in later versions is somewhere in the middle:">[[File:mathematica-default-colors.jpg|250px]]</wz></center> | ||
Latest revision as of 09:53, 21 September 2024
Mathematica colours
Mathematica has a rather extensive support for colors, but more often than not, it needs tinkering with.
Colors can be retrieved from hexadecimal codes with a # in a string:
We like to use the SunsetColors color scheme:
ColorData["SunsetColors"]
A more serious and clear scheme is to blend between red and blue with white as an intermediate. We use this for convention for bunching/antibunching (white is uncorrelated):
ColorFunction -> (Blend[{White, Blue, Red}, #] &)
This module exports a list of n colors distributed along the gradient:
lcol[n_] :=
 Module[{}, Table[ColorData["SunsetColors"][i], {i, 0, 1, 1/(n - 1)}]]
A blending of colors can be done with blend, e.g., that generates a smooth transition from red to blue in n steps:
Table[{Blend[{Red, Blue}, x]}, {x, 0, 1, 1/(n+1)}]
In ListPlot, to have points (markers) have the same color as the lines (which should be the default), add:
PlotMarkers -> Graphics@{Point[{0, 0}]
The default colors in modern versions of Mathematica is taken from: [1]
ColorData[97, "ColorList"]
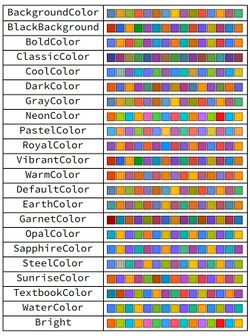
One can find the other useful themes [2]
"Color"/. Charting`$PlotThemes
 (* BackgroundColor, BlackBackground, BoldColor, ClassicColor, CoolColor,
    DarkColor,GrayColor, NeonColor,PastelColor, RoyalColor, VibrantColor, WarmColor,
    DefaultColor, EarthColor, GarnetColor, OpalColor, SapphireColor, SteelColor,
    SunriseColor, TextbookColor, WaterColor} *)

 Grid[{#,Row@(("DefaultPlotStyle"/.(Method/.
   Charting`ResolvePlotTheme[#,   ListPlot]))/.
      Directive[x_,__]:>x)}&/@("Color"/. Charting`$PlotThemes),Dividers->All]
