1st problem
The average scores per problem are (out of 10):
4.125, 6.875, 3.875, 6.125, 8., 5.75, 3.625, 2.25
making Fractals highly acclaimed and statistical inference the most dreaded (little surprise in both cases).
The average scores of group are:
5.5, 3.625, 5.875, 6.125, 5., 4.125, 4.625, 5.75
which itself has average 5.08.
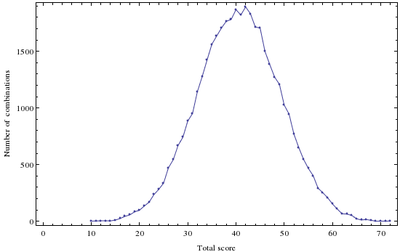
The distribution of scores:

The maximum one is 72 and minimum is 10 (out of 80). There are four degenerate combinations:
1, 5, 3, 8, 2, 4, 6, 7
1, 5, 3, 8, 4, 2, 6, 7
6, 5, 3, 8, 2, 4, 1, 7
6, 5, 3, 8, 4, 2, 1, 7
which arise from groups 1 and 7, on the one hand, and 5 and 6, on the other, having expressed equal preferences (in their own vote) for the same projects.
We are thus left with:
- Group 2-> Project 5
- Group 3-> Project 3
- Group 4-> Project 8
- Group 8-> Project 7
and then, Group (1,7)->Project (1,6) and Group (5,6)->Project (2,4)
The final scores per group are:
7, 10, 9, 8, 10, 10, 8, 10
Half the groups get their highest rated choice, one gets their 2nd best choice. One group (first) gets assigned a project with the lowest collective note (still 7) and they can chose from degeneracy.
Computación I: Projects
Robust Measures of Tail Weight
We explore the meaning of the kurtosis of a function based and https://wis.kuleuven.be/stat/robust/papers/2006/tailweight.pdf
Fractals
Runge–Kutta methods
Stochastic differential equation
Fractional Schrödinger equation
Correlations in the Hilbert space
Quantum computation
Fast Fourier Tranform
Bessel's correction
Univariate Distribution Relationships
Cellular Automata
| Computación I |
|---|
