Mandelbrot Set
No techie website is complete without featuring the Mandelbrot set somewhere.
This is this corner of our web.
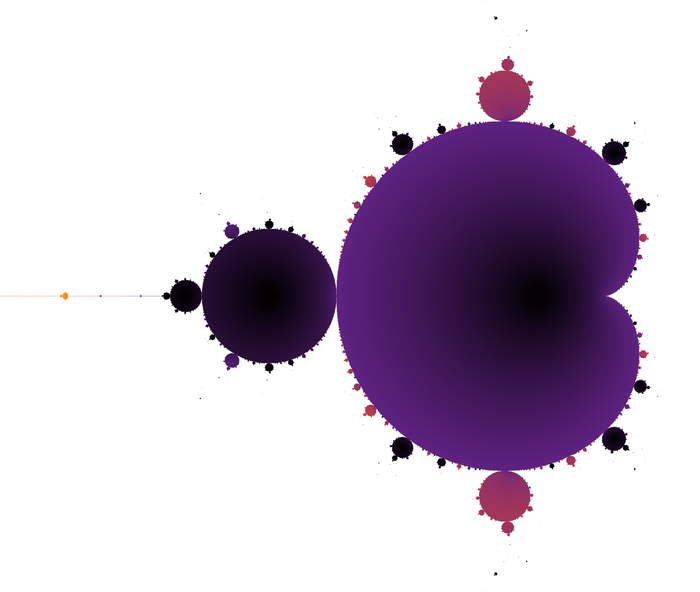
![]() The following was plotted from a code developed from scratch in a few minutes illustrations for students of my MMII course on complex analysis of how to fruitfully explore the mind-bogglingly rich geometry of complex numbers
The following was plotted from a code developed from scratch in a few minutes illustrations for students of my MMII course on complex analysis of how to fruitfully explore the mind-bogglingly rich geometry of complex numbers

This is the Mathematica code itself:
xmin = -2; xmax = .6;
ymin = -1.2; ymax = 1.2;
\[Delta]x = .01; \[Delta]y = .01;

f[c_] := Nest[(#^2 + c) &, 0, 1000]

mb1 = Map[If[# > 3, 3, #] &,
   Abs[Map[f, Table[a + I b,
         {b, ymin, ymax, \[Delta]y}, {a, xmin, xmax, \[Delta]x}], {2}]], {2}];

ArrayPlot[mb1, ColorFunction -> "SunsetColors",
   FrameTicks -> True, DataRange -> {{xmin, xmax}, {ymin, ymax}},
   ImageSize -> 1200, FrameLabel -> {"Re(z)", "Im(z)"}]
It is not optimized and will generate Overflow warnings, but generate convincingly and efficiently the familiar shape, with a nice color grading (darker colors correspond to faster convergence).
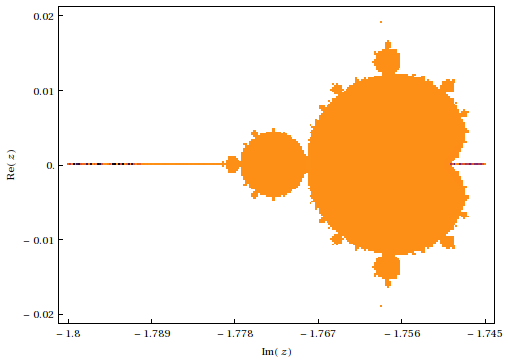
The image above used a fine grid and took about an hour to compute. The actual structure obtained in class was more along the line of the one below, the minibrot you see in orange on the left of the main figure (that took a little over half a minute to compute)
