Intensity fluctuation spectroscopy of small numbers of dye molecules in a microcavity. S. C. Kitson, P. Jonsson, J. G. Rarity and P. R. Tapster in Phys. Rev. A 58:620 (1998). What the paper says!?

This work studies a few dye molecules located in a microcavity, but the latter is only for collection of the light. The measurement of $g^{(2)}(\tau)$ is used to extract information of the various mechanisms that affect the dynamics of a single-emitter:

including, here diffusion due to Brownian motion:
If the molecule is not fixed but is free to move within a liquid, then there is a third mechanism that gives rise to fluctuations in the fluorescence signal. The molecule can diffuse out of the collection volume under Brownian motion.
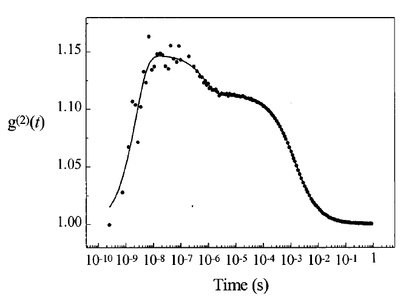
Typical shapes recorded look like this:

The antibunching (in the sense of $g^{(2)}(0)<g^{(2)}(\tau)$ although $>1$) comes from the single-emitter feature of the molecule, then the bunching at short time is due to the level structure (shelving) and long time from Brownian diffusion.
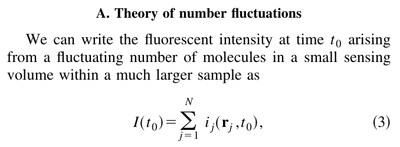
The theory combines the analysis of Pegg et al. (who are not cited) of three-level dynamics, to a more original (as far as we could judge so far) description for multi-emitters:

Working out intensity correlations of this, they arrive (in the limit of large $N$) to

where $\eta$ is some "efficiency factor" describing the collection volume to relate intensity to probabilities $p$, which they provide some expression for following statistical assumptions, that is provided in Eq. (12). Basically, the various molecules makes $g^{(2)}(0)=1$ (from $N(N-1)/N^2\to 1$) and thus their dynamics is the bunching elbows on top of uncorrelated emission. Which is indeed the type of shapes they measure. From such analysis, they can still determine the (mean) number of molecules within their collection volume.