Elena & Fabrice's Web
No higher resolution available.
Everyman2.png (598 × 307 pixels, file size: 11 KB, MIME type: image/png)
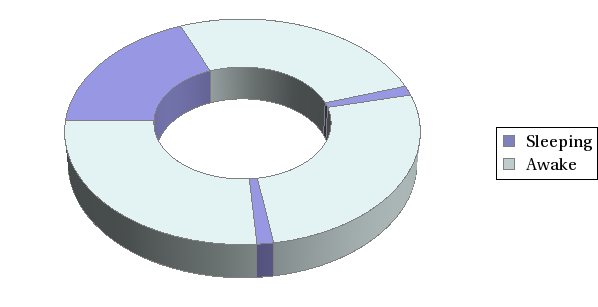
This was generated with the Mathematica command:
PieChart3D[{4.5, 6.28, .33, 6.28, .33, 6.28},
 ChartLegends -> {"Sleeping", "Awake"},
 SectorOrigin -> {Automatic, 1},
 ChartStyle -> {RGBColor[.5, .5, .75], RGBColor[.75, .8, .8]}]
File history
Click on a date/time to view the file as it appeared at that time.
| Date/Time | Thumbnail | Dimensions | User | Comment | |
|---|---|---|---|---|---|
| current | 05:40, 1 March 2012 | | 598 × 307 (11 KB) | Fabrice (Talk | contribs) | |
| 05:20, 1 March 2012 | 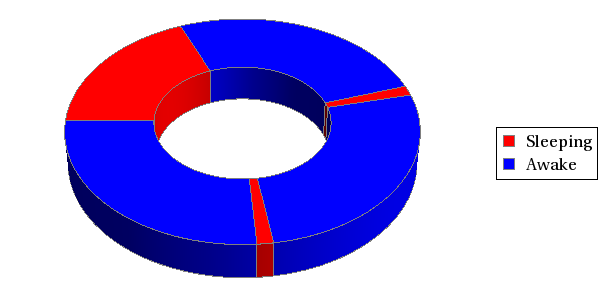 | 598 × 307 (9 KB) | Fabrice (Talk | contribs) |
- You cannot overwrite this file.
- Edit this file using an external application (See the setup instructions for more information)
File usage
The following page links to this file: